Methods used in the beneficiation of Egyptian silica sand and dry magnetic separation by ERGA RollMag
- #silica sand
- #purification
- #enrichment methods
- #dry magnetic separation
Abstract
Silica sand is that SiO2 particles smaller than 2 mm resulting from the decomposition of magmatic and metamorphic rocks containing high quartz (SiO2). It contains impurities such as clay, feldspar, lime, iron oxide, and carbonates. Silica sand has a wide range of uses from the glass industry to the chemical industry. Depending on the area where it is used, the clay and iron content of silica sand must be below a certain value. In this respect, the methods used to beneficiate silica sand will be compared. Additionally, silica sand from Egypt was individually beneficiated using the dry magnetic separation method for two different samples. Magnetic roll separator ERGA RollMag was used for this process. The silica content in the sand was increased to 99.84%, and the iron values were reduced to below 0.01%. In this respect, based on literature and experimental data, the applicability of dry magnetic methods has been demonstrated.
1. Introduction
The main element of silica sand is silicon, the most abundant element in the universe. Silicon, with an atomic number of 14 and an atomic weight of 2.33 g/cm3, has diamagnetic properties. Quartz mineral contains 46.5% Si and 53.3% O2 in pure form.
Silica sand is generally white in color. However, it may vary from red to brown due to the iron oxide and other impurities it contains. It contains impurities such as clay, feldspar, lime, iron oxide, and carbonates. The removal of these impurities is essential to ensure the quality and economy of the final product. Therefore, depending on its intended use, silica sand is subjected to physical, physicochemical, or chemical processes for mineral processing.
Depending on its impurities and particle size, silica sand can be used in various industries, including glass, cement, textile, electronics, chemical, dyeing, casting, and metallurgy. For instance, in the glass industry, ordinary glass produced by the volt method requires silica sand with SiO2 (silicon dioxide) content of 90-98.5%, Fe2O3 (iron oxide) of 0.05-0.30%, and Al2O3 (alumina) of 5.5-1.0%, with a particle size of 0.710mm-0.106mm. For photovoltaic glass, the sand should have SiO2 content of 99.50% and Fe2O3 of 0.0080%, with the same particle size of 0.710mm-0.106mm. For electronic glass, the sand needs SiO2 content of 99.60-99.80% and Fe2O3 of 0.0020-0.0050%, with a particle size of 0.600mm-0.065mm.
| Areas of Usage | Standards Properties |
|---|---|
| Production of Glass | It must contain minimum 98% SiO2, maximum 0.1% Fe2O3, and the particle size range must be -0.500 +0.106 mm. |
| Dinas Bricks | SiO2 ratio is 95-99%, Fe2O3 ratio is 0.3-1.3%; Al2O3 content 0.1-2.8%; CaO content 0.2-2.4%; Na2O and K2O content should be 0.2-1.5%. Low-quality dinas brick production is made from silica sands containing 87-96% SiO2. |
| Slag Former | SiO2 ratio minimum 90%, Al2O3 and Fe2O3 ratio maximum 1.5%; MgO and CaO content should be maximum 0.2%. |
| Moulding | Silica sand must be -0.7+0.1mm in particle size evenly distributed and should not sinter at 1500oC. SiO2 content must be minimum 95%, total of CaO and alkali must be minimum 0.6%. |
| Production of Ferrosilicon | SiO2 ratio should be minimum 96-98%, Al2O3 and Fe2O3 ratio should be maximum 0.2%. |
| Gas Concrete | The SiO2 ratio must be at least 75.5%, at least 95% in building sand, and at least 80% in pressed brick construction. |
| Ceramic Clay | SiO2 content 90-92%; Al2O3 content 6-8%; Fe2O3 content 0.5%; TiO2 ratio should be 0.45%. The SiO2 content of the silica sand to be used in frit and glaze production should be at least 99.4%, the Al2O3 rate should be 0.01%, the Fe2O3, TiO2, CaO, MgO, and Na2O content should be 0.03%, and the K2O rate should be 0.06%. Silica sands to be used for this purpose should have 8.0-26.5% material in the +0.032 mm size group and 73.5-92.0% material in the -0.032 mm size group. |
2. Silica Sand Enrichment Methods
To obtain high purity silica sand, impurities in the raw quartz ore or silica sand need to be removed. In order to remove these impurities, it is very important to identify the raw material physically, chemically, and mineralogically. If the appropriate method is selected according to the content of the raw material, silica sand is enriched. Enrichment methods for silica sand are examined under four main headings. The methods can be used alone or in combination to remove impurities and increase the content of silica sand.
2.1. Chemical Method
It is effective in removing impurities that are bonded with chemical bonds and are not sufficiently liberated. Hydrometallurgical method is used as chemical enrichment for silica sand. Hydrometallurgy is the extraction of metal from ore by preparing an aqueous solution of a salt of the metal and recovering the metal from the solution.
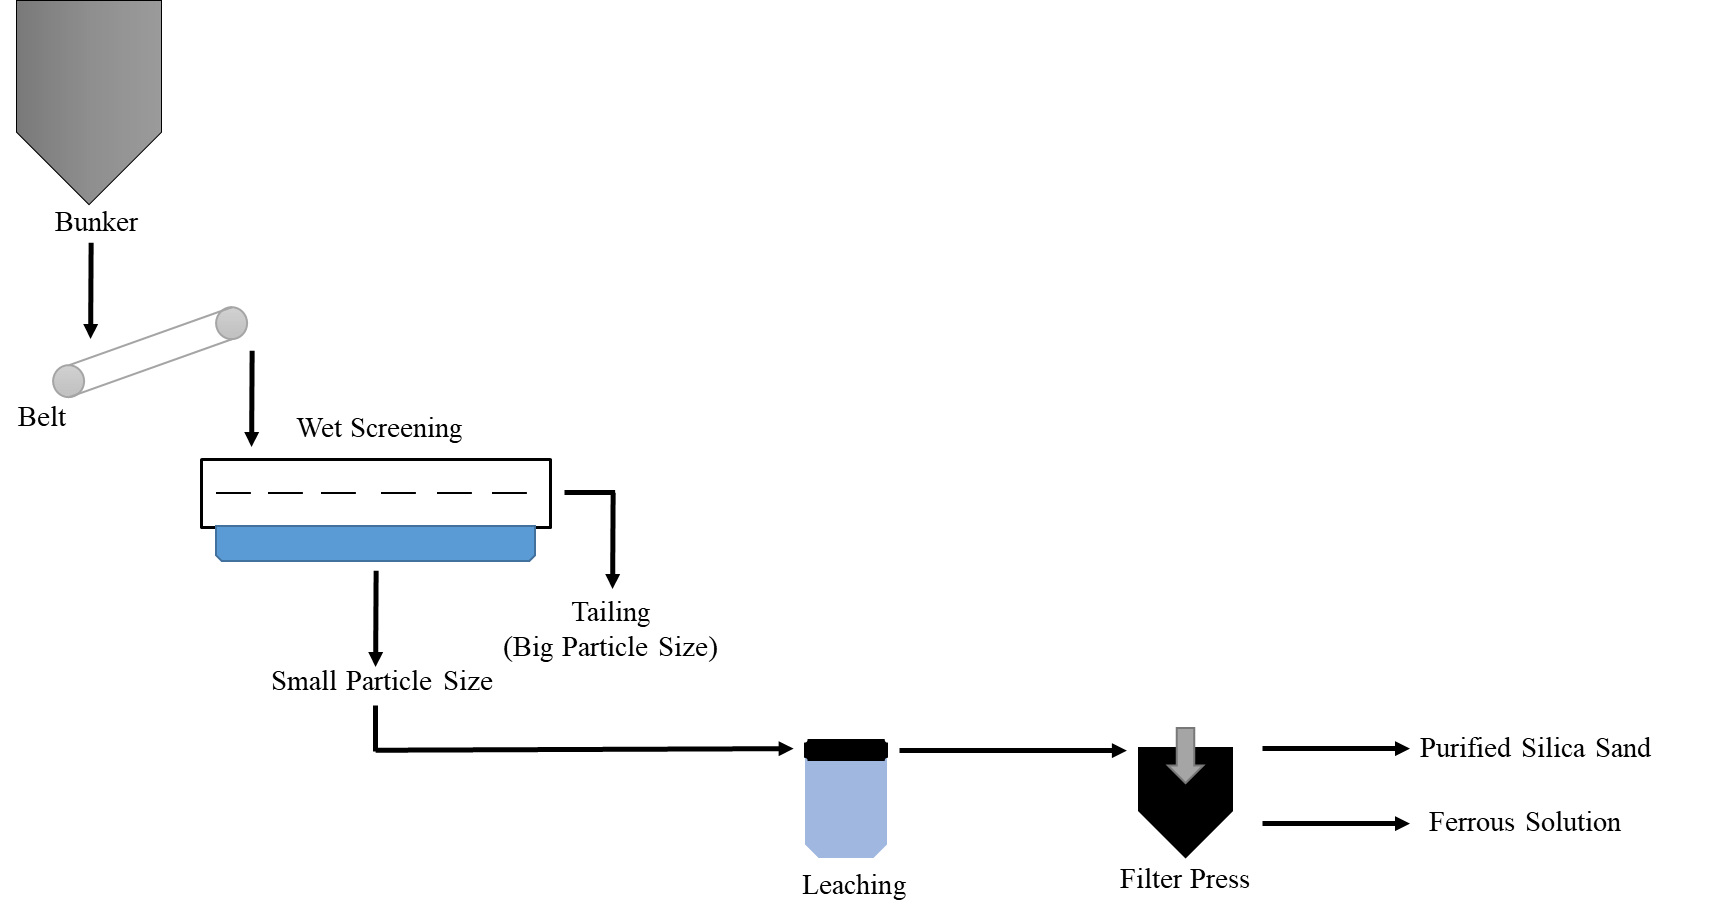
Figure 1: Flowchart of Basic Leaching for Silica Sand
In the leaching method, the minerals that will go into solution and the minerals that will remain in the solid phase must be determined and dissolved suitable for the ore. Then the solution is filtered and the iron passing into the solution is separated from the silica remaining. The only acid that affects quartz minerals is hydrofluoric (HF) acid. In solution, it is used in organic acids such as oxalic (COOH)2, citric (C6O8H7), and ascorbic (C6O8H6) acids, as well as inorganic acids such as hydrochloric acid (HCl), sulfuric acid (H2SO4), and perchloric acid (HClO4). When HCl and H2SO4 are used as solutions, the ore must be thoroughly cleaned from Cl and SO4 ions by washing after separation.
2.2. Physicochemical Method
In the physicochemical method, the flotation process is used to enrich silica sand. Flotation is the floating or sinking of the ore by creating bubbles in water by taking advantage of its hydrophilic and hydrophobic properties. Reverse flotation process is used for silica sand because the silica ratio by weight is higher than other impurities. Fatty acids, sulfonates, soaps, and amines are used in this process.
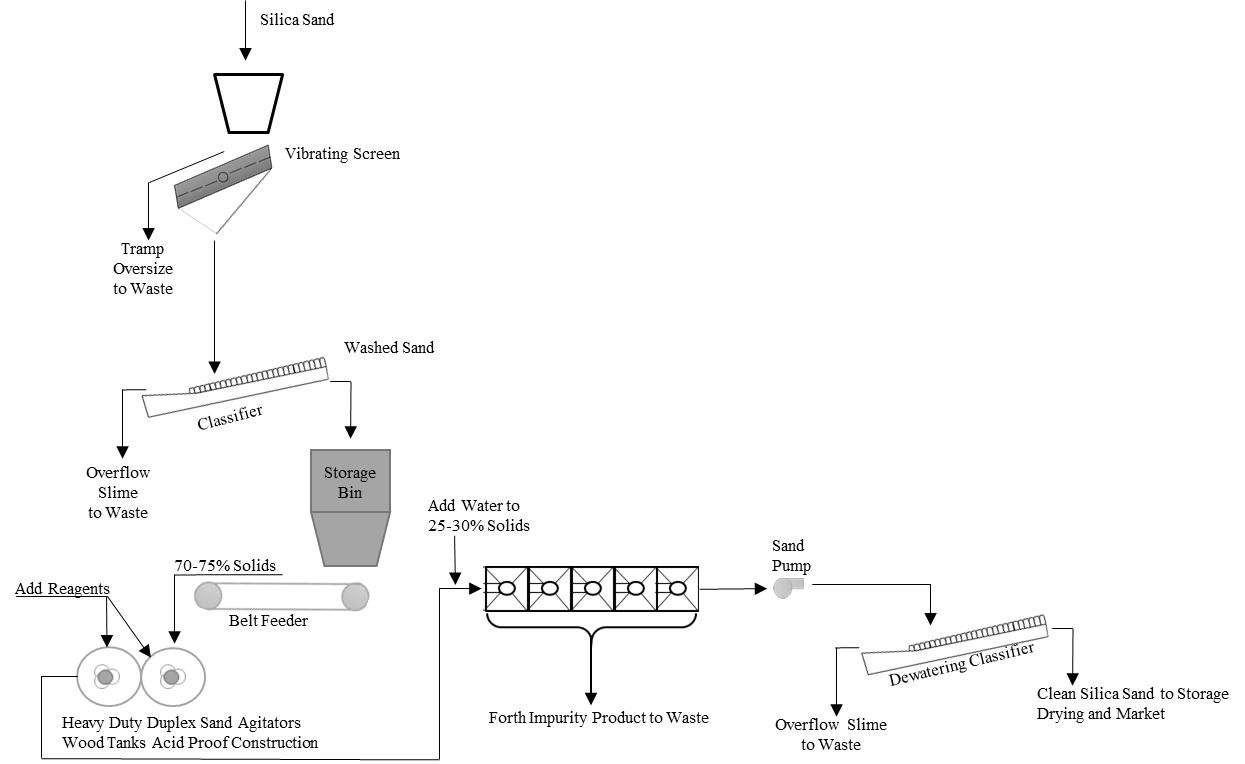
Figure 2: Flowchart of Flotation for Silica Sand
2.3. Physical Method
The minerals in the physical enrichment raw material are separated according to their physical properties such as density, magnetic properties, and color. Four different methods will be discussed in the physical method of enrichment of silica sands: scrubbing and classification, gravimetric separation, electrostatic separation, and magnetic separation.
2.3.1. Scrubbing And Classification
Impurities such as clay contained in silica sand are mixed at a solid ratio of 65-75% in a scrubber. In this way, the clay is cleaned from the silica sand surface by rubbing. The cleaned material is brought to the appropriate solid ratio to water, and the slurry removal process is usually carried out in the cyclone.
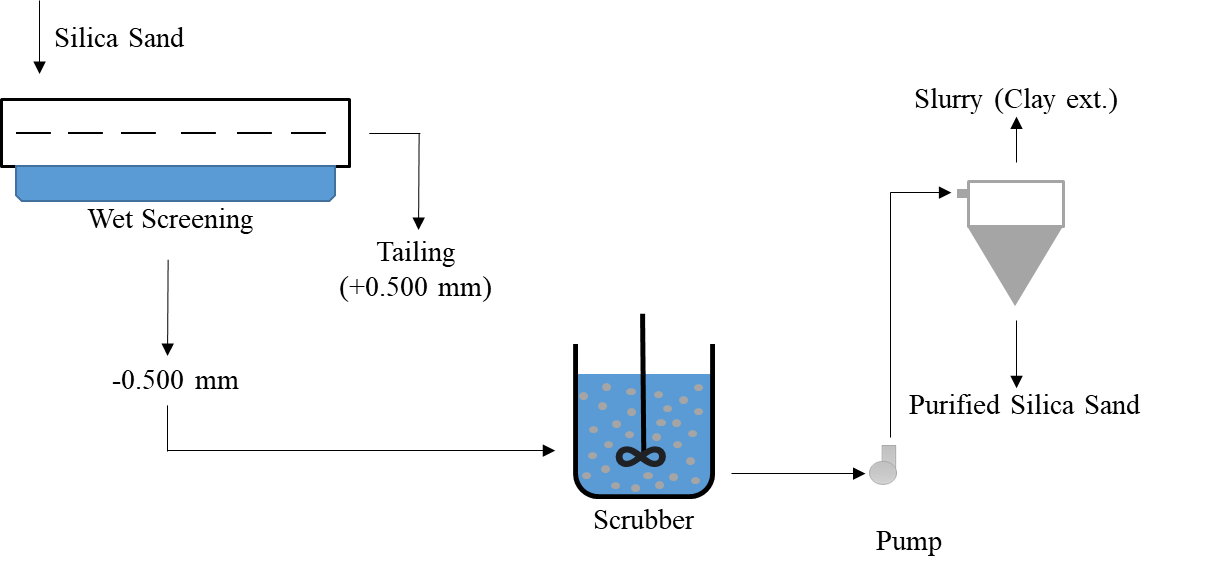
Figure 3: Flowchart of Scrubbing and Classification for Silica Sand
2.3.2. Gravimetric Separation
In this method, the density difference between minerals is used. The equipment to be used is selected according to the density difference between minerals. For example, there should be a density difference of at least 1 g/cm3 for the shaking table and 0.5 g/cm3 for the spiral.
| Mineral | Density (g/cm3) | Mineral | Density (g/cm3) |
|---|---|---|---|
| Quartz | 2.65 | Limonite | 3.8 |
| Glauconite | 2.2-2.9 | Anatase | 3.9 |
| Feldspar | 2.5-2.7 | Brookite | 3.9 |
| Andalusite | 3.2 | Rutile | 4.0 |
| Fibrolite | 3.2 | Chromite | 4.4 |
| Tourmaline | 3.1 | Ilmenite | 4.7 |
| Staurolite | 3.6 | Zircon | 4.7 |
| Muscovite | 2.8 | Pyrite | 5.0 |
| Kyanite | 3.6 | Magnetite | 5.2 |
| Leucoxene | 3.6 | Hematite | 5.26 |

Figure 4: Flowchart Using Spiral for Silica Sand
2.3.3. Electrostatic Separation
Electrostatic separation for silica sand is done based on the reversibility and voltage differences of minerals. Electrostatic properties of some minerals are given in the table below. This method can be used as an additional purification step.
| Mineral | Chemical Formula | Electrostatic Property |
|---|---|---|
| Quartz | SiO2 | - |
| Ilmenite | FeTiO2 | + |
| Magnetite | Fe3O4 | +++ |
| Hematite | Fe2O3 | ++ |
| Andalusite | Al2O3.SiO2 | +++ |
| Sillimanite | Al2O3.SiO2 | - |
| Muscovite | (HKAlSiO4) | - |
2.3.4 Magnetic Separation
Magnetic separation is used in the enrichment of quartz minerals due to its economy and high efficiency. This method is based on the principle of removing iron-containing coloring impurities such as hematite and siderite, which reduce the quality of quartz minerals and are undesirable in the industry in which they are used by using their magnetic susceptibility. In this separation, high field intensity magnetic separators are generally used.
| Mineral | Chemical Formula | Magnetic Property |
|---|---|---|
| Quartz | SiO2 | - |
| Ilmenite | FeTiO2 | ++ |
| Magnetite | Fe3O4 | +++ |
| Hematite | Fe2O3 | ++ |
| Andalusite | Al2O3.SiO2 | - |
| Sillimanite | Al2O3.SiO2 | - |
| Muscovite | (HKAlSiO4) | - |
3. Materials and Method
3.1. Materials
The samples studied are from the Egyptian region. In this study, the samples will be referred to as E01 and E02, taken from the same region but different areas. A total of four different tests will be performed for both samples, low and high capacity. There will be three-stage cleaning in all four tests. A rotary sample divider was used to split and obtain representative samples. Sieve analysis, XRF, and geochemistry analyses were performed to identify the samples.
3.1.1. Sieving Analysis
An electromagnetic sieve shaker was used for sieve analysis. A set of sieves ranging from 500, 315, 200, 100, and 71 µm were used for particle size distribution analysis. The dry sieving time was set to 60 minutes for testing with normal shaking power. Therefore, 98% of the samples were smaller than 500 microns; they were not subjected to any crushing or grinding processes.
| Grain Size (µm) | W (%) | Cum. US | Cum. RS |
|---|---|---|---|
| +500 µm | 4.34 | 10.000 | 4.34 |
| -500 µm +315 µm | 88.76 | 95.66 | 93.10 |
| -315 µm +200 µm | 5.13 | 6.90 | 98.22 |
| -200 µm +100 µm | 1.48 | 1.78 | 99.70 |
| -100 µm +71 µm | 0.20 | 0.30 | 99.90 |
| -71 µm +0.0 | 0.10 | 0.10 | 100.00 |
| Total | 100 |
| Grain Size (µm) | W (%) | Cum. US | Cum. RS |
|---|---|---|---|
| +500 µm | 1.02 | 100.00 | 1.02 |
| -500 µm +315 µm | 68.80 | 98.98 | 69.82 |
| -315 µm +200 µm | 19.35 | 30.18 | 89.17 |
| -200 µm +100 µm | 9.55 | 10.83 | 98.72 |
| -100 µm +71 µm | 0.94 | 1.28 | 99.66 |
| -71 µm +0.0 | 0.34 | 0.34 | 100.00 |
| Total | 100 |
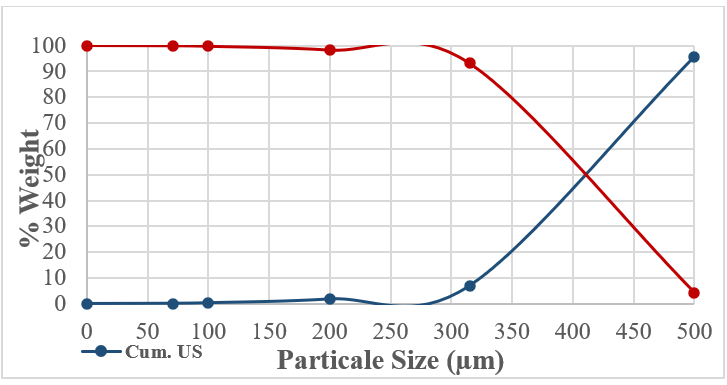
Figure 5: E01 The Cumulative Undersize and Oversize Distribution
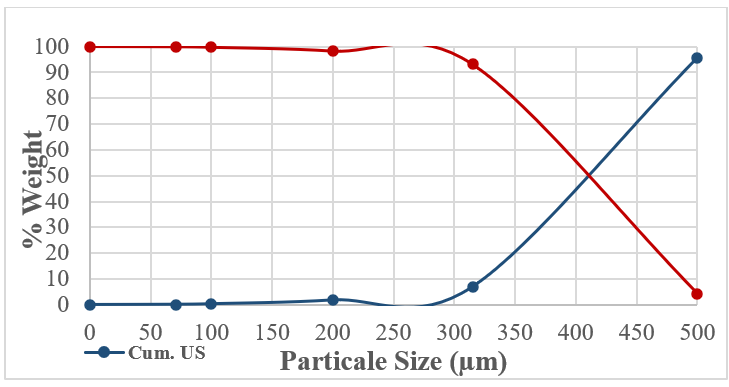
Figure 6: E02 The Cumulative Undersize and Oversize Distribution
3.2. Method
In enrichment studies, the magnetic separation method was applied as a dry and physical process. In magnetic separation experiments, ERGA brand RollMag model magnetic separator with high field intensity was used. E01 and E02 silica sands were cleaned in three steps: low and fast capacity. Flow charts for test trials are given below, and yields for the tests are given in Table 7. An example microscope image for magnetic and non-magnetic fractions is given in Figures 8 and 9.
| Test No. | Yield (%) | |||
|---|---|---|---|---|
| E01 Test 1 | E01 Test 2 | E02 Test 3 | E02 Test 4 | |
| Magnetic Fraction 1 | 0,23 | 0,35 | 0,15 | 0,22 |
| Magnetic Fraction 2 | 0,05 | 0,15 | 0,08 | 0,09 |
| Magnetic Fraction 3 | 0,04 | 0,13 | 0,05 | 0,08 |
| Non-Magnetic Fraction | 99,68 | 99.37 | 99.72 | 99,61 |
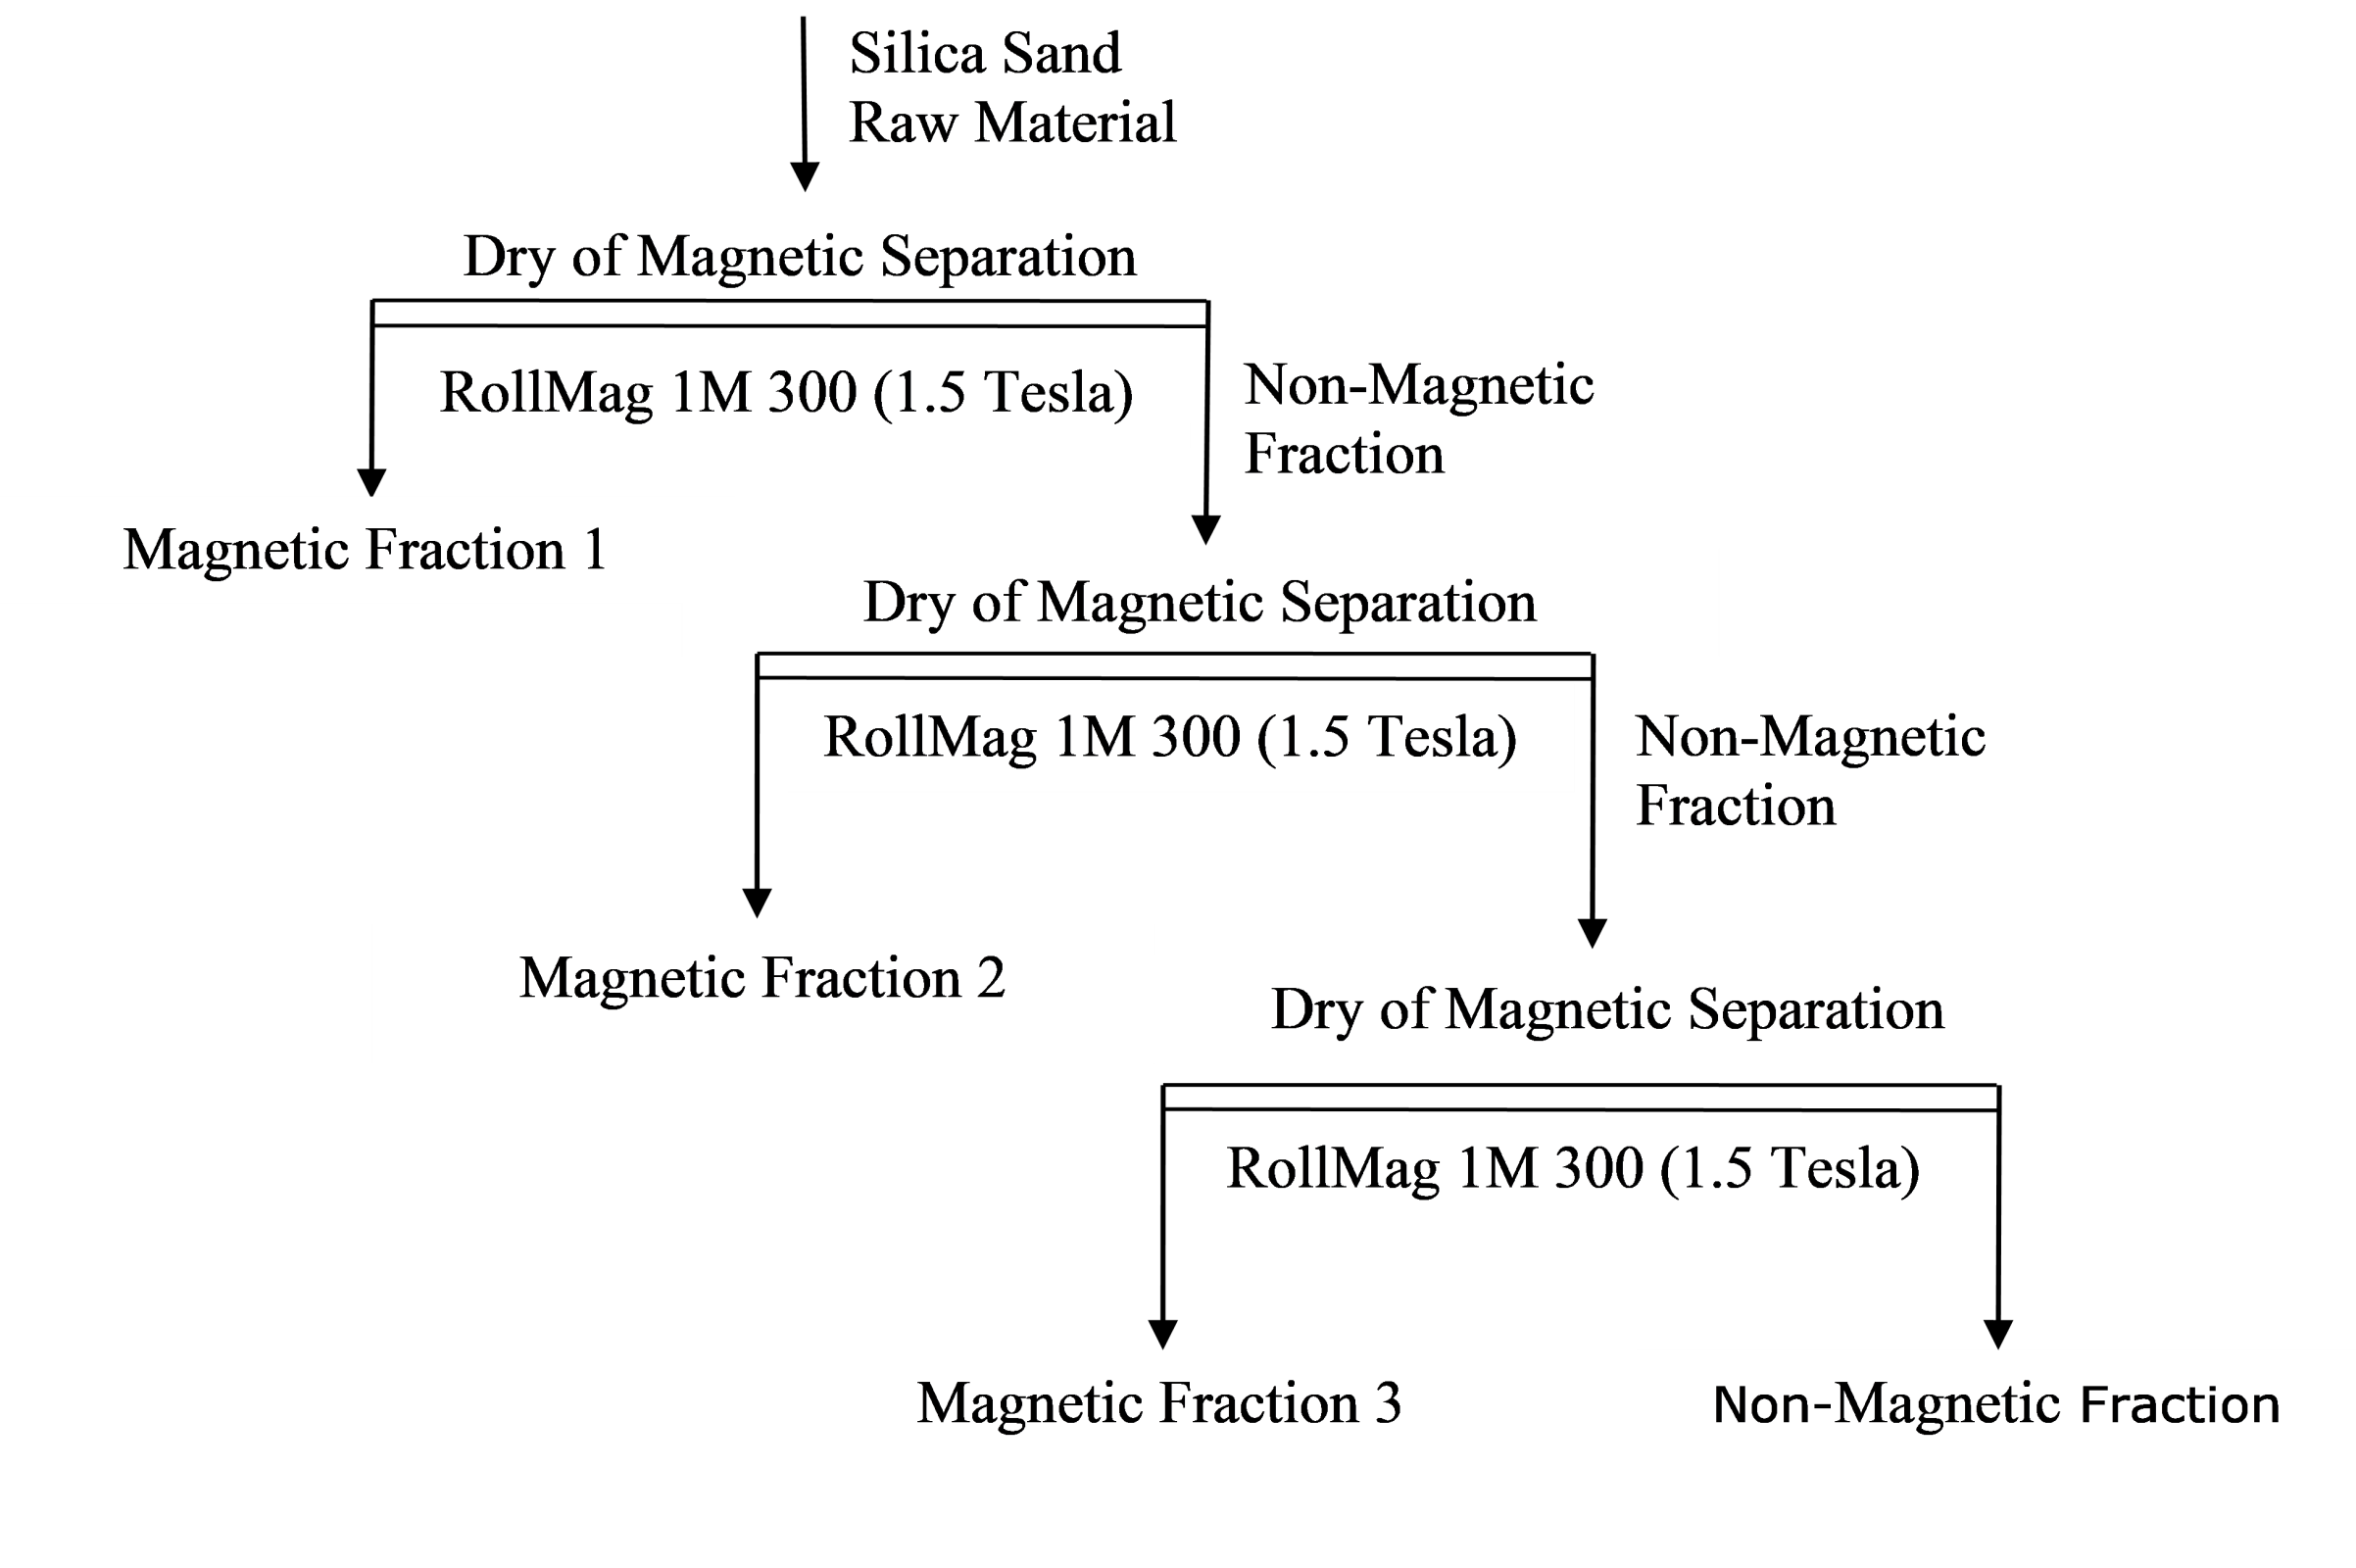
Figure 7: Flowchart for Tests
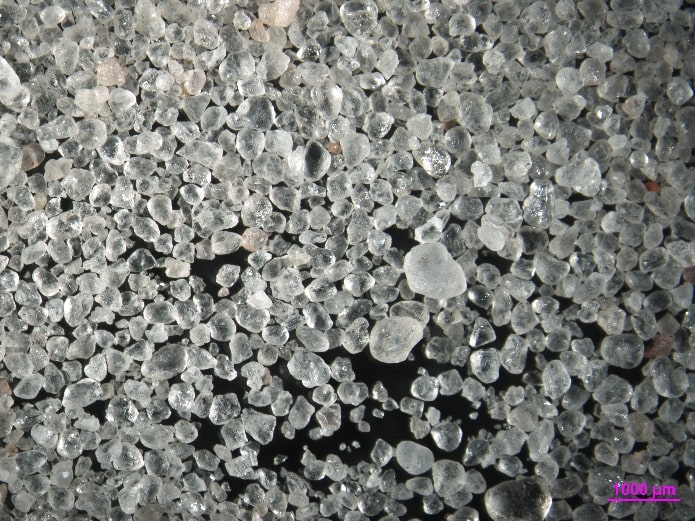
Figure 8: Non-Magnetic Fraction
Looking at the microscope images, it is observed that a very clean and pure silica sand is obtained in the non-magnetic fraction. Some pinkness are hematoid (pink quartz) due to Mg content. Slight jaundice is due to citrine, which depends on the ferric oxide content.
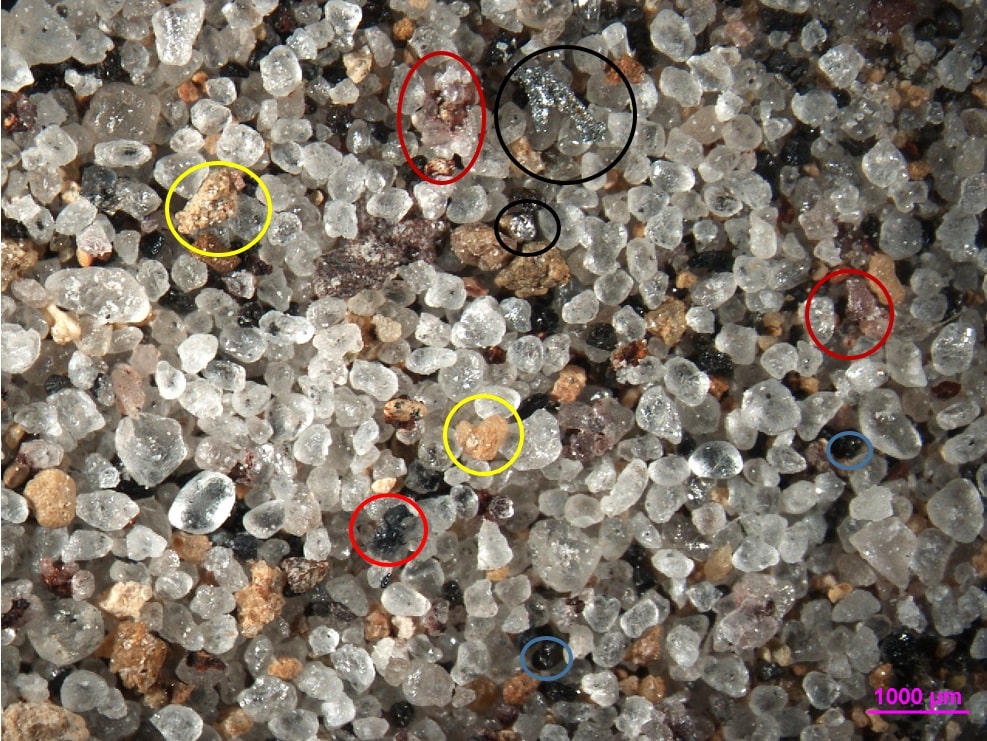
Figure 9: Magnetic Fraction
When looking at the magnetic fraction, the minerals circled in black are ilmenite, the red minerals in the red circle are garnet, and the yellow minerals in the yellow circle are limonite. The black minerals shown with blue circles are staurolite, considering the Al and Ca content in the feed material. White particles came to this fraction due to the ferrooxides they contain. The extraction of quartz with iron oxide inclusions demonstrates the high intensity of the RollMag magnetic field capable of extracting these impurities.
Test 1 was worked at a high capacity. The material feeding speed is faster than Test 2. SiO2 value has increased by 0.72% from 98.90% to 99.62% compared to the raw material. It didn't change anything for results according to raw material for TiO2, BaO, SrO, MnO, MgO, Na2O, K2O, Cr2O3, Fe2O3 and P2O5 values.
Test 2 was worked at a low capacity. SiO2 value has increased by 0,33% from 98.90% to 99.23% compared to the raw material. This increase is 0.39% lower than Test 2. It didn't change anything for results according to raw material for TiO2, BaO, SrO, MnO, MgO, Na2O, K2O, Cr2O3, Fe2O3 and P2O5 values.
Test 3 was worked at a high capacity. The material feeding speed is faster than Test 4. SiO2 value has increased by 1.03% from 97.99% to 99.02% compared to the raw material. However; Fe2O3 value has decreased by 0,05% from 0.17% to 0.12%. Al2O3 decreased by 0.35% from 0.81% to 0.46%, CaO decreased by 0.16% from 0.17% to <0.1% and Loss in Ignition decreased by 0,10% from 0.08% to -0.02%. It didn't change anything for results according to raw material for TiO2, BaO, SrO, MnO, MgO, Na2O, K2O, Cr2O3 and P2O5 values.
Test 4 was worked at a low capacity. SiO2 value has increased by 0,65% from 97.99% to 98.64% compared to the raw material. This increase is 0,38% lower than Test 3. However; Fe2O3 value has decreased by 0,16% from 0.17% to <0.1%. Test 4 compared to Test 3, the Fe2O3 value was cleared 0.11% better. Al2O3 decreased by 8% from 0.81% to 0.73% and Loss in Ignition decreased by 0,13% from 0.08% to -0.05%. It didn't change anything for results according to raw material for CaO, BaO, SrO, MnO, MgO, TiO2, MgO, Na2O, K2O, Cr2O3 and P2O5 values.
Finally, according to concentrate analysis results and gravimetric method the SiO2 value was increased by 0.15% from 99,68% to 99,83% for Test 1 and by 0.16% from 99,68% to 99,84% for Test 2. 0.26% for both tests from 99.55% to 99.81% or Test 3 and Test 4.

Figure 10. ERGA RollMag-Working Principle
The working principle of RollMag is from the receiving hopper of the separator, the material enters the vibrating feeder from where it is fed in a uniformly distributed flow to the belt conveyor with a magnetic drive shaft. The magnetically susceptible inclusions located in the stream of enriched material are attracted to the shaft under the influence of the magnetic field created by the shaft and are held on the surface of the Kevlar tape enveloping it, which moves the inclusions to the unloading zone. A divider plate installed under the magnetic shaft is used to separate the flow of the non-magnetic component of the material from the flow of inclusions with low magnetic susceptibility, which change the trajectory of movement under the influence of a powerful magnetic field. The material fed in RollMag, which offers a wide range of RPM changes, was kept constant in each test and was fed from the vibrating feeder at an average speed of 25 RPM and enriched at a roll speed of 40 RPM. The inclination angle can also change, but this parameter is kept constant. In these experiments, the capacity will be tested, and the appropriate capacity will be selected. Studies have shown that three cleaning steps are sufficient to obtain SiO2 with a minimum content of 99.80%, and the RollMag device is used in the industrial area to perform three-step cleaning. For this reason, the material consists of three cleaning stages.
X-Ray Fluorescence (XRF) Analysis
X-ray Fluorescence (XRF) determines the elements by calculating the energy of the X-rays obtained from the analyzed sample. Analysis results for E01 and E02 raw material samples and test products are given in Table 8.
| IUPAC Name | Chemical Formula | E01 Raw Ma. | E02 Raw Ma. | E01 Test 1 | E01 Test 2 | E02 Test 3 | E02 Test 4 |
|---|---|---|---|---|---|---|---|
| Silicon Dioxide | SiO2 | 98.90 | 97.99 | 99.62 | 99.23 | 99.02 | 98.64 |
| Iron (III) Oxide | Fe2O3 | 0.37 | 0.81 | <0.01 | <0.01 | 0.12 | <0.01 |
| Aluminum Oxide | Al2O3 | <0.01 | 0.17 | <0.01 | <0.01 | 0.46 | 0.73 |
| Titanium Dioxide | TiO2 | <0.01 | <0.01 | <0.01 | <0.01 | <0.01 | <0.01 |
| Calcium Oxide | CaO | <0.01 | 0.17 | <0.01 | <0.01 | <0.01 | 0.17 |
| Magnesium Oxide | MgO | <0.01 | <0.01 | <0.01 | <0.01 | <0.01 | <0.01 |
| Sodium Oxide | Na2O | <0.01 | <0.01 | <0.01 | <0.01 | <0.01 | <0.01 |
| Potassium Oxide | K2O | <0.01 | <0.01 | <0.01 | <0.01 | <0.01 | <0.01 |
| Loss in Ignition | L.O.I. | 0.15 | 0.08 | 0.10 | 0.02 | -0.02 | -0.05 |
| Chromium (III) Oxide | Cr2O3 | <0.01 | <0.01 | <0.01 | <0.01 | <0.01 | <0.01 |
| Phosphorus Pentoxide | P2O5 | <0.01 | <0.01 | <0.01 | <0.01 | <0.01 | <0.01 |
| Barium Oxide | BaO | <0.01 | <0.01 | <0.01 | <0.01 | <0.01 | <0.01 |
| Strontium Oxide | SrO | <0.01 | <0.01 | <0.01 | <0.01 | <0.01 | <0.01 |
| Manganese (II) Oxide | MnO | <0.01 | <0.01 | <0.01 | <0.01 | <0.01 | <0.01 |
Gravimetric Analysis
Gravimetric analysis is a method in analytical chemistry to determine the quantity of an analyte based on the mass of a solid. The reason why this method is preferred is that the silica sand is close to purity.
| IUPAC Name | Chemical Formula | E01 Raw Ma. | E02 Raw Ma. | E01 Test 1 | E01 Test 2 | E02 Test 3 | E02 Test 4 |
|---|---|---|---|---|---|---|---|
| Silicon dioxide | SiO2 | 99.68 | 99.55 | 99.83 | 99.84 | 99.81 | 99.81 |
4. Conclusion
The purity of silica sand varies depending on its intended use, with the glass and optical industries requiring a SiO2 content of 99.80%. A literature review reveals various methods to enrich silica sand. However, chemical methods like leaching face significant disadvantages, including environmental impact and the high cost of chemicals. Although the flotation process can handle fine grain sizes, it too poses environmental and economic challenges. Wet processes such as attrition scrubbing and gravimetric methods necessitate drying the material afterward.
Electrostatic separation is used as an additional step in the purification of silica sand at a rate of 99.99% as a result of studies. It is suitable for magnetic enrichment conditions due to the silica sand's content. There is no need to heat and dedust the material as in electrostatic separation. This study focused on using a high-intensity dry magnetic separator. For E01 material, it is achieved a 99.37% yield with 99.84% SiO2 content, while E02 material yielded 99.61% with 99.81% SiO2 content. High-capacity results showed that silica sand could be fed at high capacity without significant differences in grade and yield.
The purified silica sand meets the stringent requirements of the glass and optical industries. Considering the advantages of this dry process, long magnet life, and high capacity, magnetic roll separator ERGA RollMag is an excellent option for silica sand purification.
References
- https://www.mta.gov.tr/v3.0/bilgi-merkezi/kuvars-kumu (March 2024)
- Yıldız N.; Cevher Hazırlama ve Zenginleştirme IV. Cilt Minerallerin Zenginleştirilmesi 42. Bölüm Ankara 2022
- https://www.linkedin.com/pulse/what-impurities-need-removed-different-glass-making-sam-zhang/ (March 2024)
- Karagüzel C. 2019. Endüstriyel Silikatlar Özellikleri ve Zenginleştirme Yöntemleri; Genel Bakış. Aydın Maden Potansiyelinin Değerlendirilmesi Çalıştayı. TMMOB Maden Mühendisleri Odası Yayını.
- Hacıfazlıoğlu H. Silis Kumunun Zenginleştirilmesinde Kullanılan Yöntemler Ve Flotasyon İle Manyetik Ayırma Yöntemlerinin Demir Giderimi Bakımından Karşılaştırılması Madencilik Dergisi 50(3) 35-48 2011.
- Aydın B. Oğuz C.N. Gül A. Düşük Kalite Kuvars Kumlarının Flotasyon ve Oksalik Ait Liçi ile Zenginleştirilmesi Madencilik Dergisi 60(1) 7-20 2021
- https://www.911metallurgist.com/blog/tag/silica (March 2024)
- Alali J. Mineral Processing of Silica Sand in Hanout Area/South of Jordan Open Journal of Geology 13 667-696 2023
- Manel B.F. Wissem G. Saadi A. Quartz sand beneficiation using magnetic and electrostatic separation to glass industries Journal of New Technology and Materials Vol. 06 N°01 (2016)60-72 2016
- Khaled E. Yassin S.H. Mourad M.M.H. Khalil N.A. Abdel-Khalek1 A. M. Elbendari1 K.A. Selim El-Sayed R.E. Hassan Upgrading and Surface Coating of Egyptian White Sand with Polymers and Silanes March 2024
- Al-Abady A. Characterization and potential upgrading of El-Zaafarana White Sand by Attrition scrubbing Journal of University of Shanghai for Science and Technology ISSN: 1007-6735 April 2022
- Haghi H.; Noaparast M. Iron Removal from Relatively Low Grade Silica Using Magnetic Separation XXVII International Mineral Processing Congress (IMPC 2014) Chapter 18 Magnetic Separation and Urban Mining pp 84-93 At: Santiago Chile 2014.
- Al-Maghrabi M.N.H. Improvement of Low Grade Silica Sand Deposits in Jeddah Area Engineering Sciences Cilt.15 No. 2 s. 113-128 2004.
- Haghi H. Noaparast M. Ghadyani A. Ghorbani A. Reduction of Iron Content from Shenin Silica Mine by Reverse Flotation Proceedings of the XII International Mineral Processing Symposium (IMPS 2010) Nevsehir Turkey pp 465-474 2010.